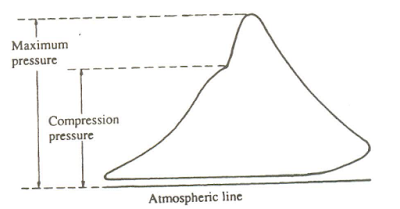
AN INDICATOR DIAGRAM IS A PRESSURE/VOLUME DIAGRAM TAKEN FROM THE PRESSURES IN THE CYLINDER OF A WORKING ENGINE DURING ONE COMPLETE ENGINE CYCLE.
POWER GENERATED IN ENGINE CYLINDER CAN BE EVALUATED BY INDICATOR DIAGRAM. IT INDICATES THE PERFORMANCE OF THE ENGINE AND IRREGULARITIES, IF ANY, CAN BE DETECTED.
INDICATOR DIAGRAMS ARE RECORDED BY INDICATOR INSTRUMENT. THREE TYPES OF INDICATOR DIAGRAMS CAN BE OBTAINED. THEY ARE POWER CARD, DRAW CARD AND LIGHT SPRING DIAGRAM.
INDICATOR INSTRUMENT
An engine indicator is shown in Figure. It is used for recording the engine cycle. It consists of a small piston of known size which operates in a cylinder against a specially calibrated spring. The engine cylinder pressure is applied against indicator piston which reciprocates an amount depending on calibration of spring. The vertical motion of piston is recorded by a stylus on a recording device on a paper wrapped around the oscillating drum.
The drum oscillates i.e swing from front to back due to the cord pull. The cord is moved by a reciprocating (up and down) mechanism which is proportional to the movements of the piston in the cylinder. At different points of the stroke the stylus draws out indicator diagram representing the gas pressure on the engine piston , and the area of the indicator diagram represents the power developed in the cylinder.
The drum oscillates i.e swing from front to back due to the cord pull. The cord is moved by a reciprocating (up and down) mechanism which is proportional to the movements of the piston in the cylinder. At different points of the stroke the stylus draws out indicator diagram representing the gas pressure on the engine piston , and the area of the indicator diagram represents the power developed in the cylinder.
PEAK PRESSURE INDICATOR
This instrument will measure the maximum pressure within the cylinder. It does not identify the position within the cycle at which it occurs. It is similar in principle to the engine indicator but uses beam type spring which is less susceptible to vibration.
The indicator is attached to indicator cock and when the cock is opened the pressure raises the indicator piston which records maximum beam deflection on a dial gauge.
If the fuel is shut off from that cylinder, the maximum compression pressure can be recorded and the “ignition jump” can be calculated (difference between peak pressure and compression pressure).
INDICATOR DIAGRAMS
1. POWER CARD IS TAKEN WITH THE INDICATOR DRUM ROTATION IN PHASE WITH PISTON MOVEMENT.
THE AREA WITHIN THIS DIAGRAM REPRESENTS THE WORK DONE DURING THE CYCLE TO SCALE.
THIS IS USED TO CALCULATE THE POWER PRODUCED OR THE MEAN INDICATED PRESSURE (MIP) FOR THE CYLINDER.
IRREGULARITIES IN THE SHAPE OF THE DIAGRAM WILL SHOW OPERATIONAL FAULTS.
MAXIMUM OR PEAK PRESSURE MAY BE MEASURED TO SCALE BETWEEN THE ATMOSPHERIC LINE AND THE HIGHEST POINT ON THE DIAGRAM.
2. DRAW CARD OR OUT OF PHASE DIAGRAM-
IT IS TAKEN IN A SIMILAR MANNER TO THE POWER CARD BUT THE INDICATOR DRUM 90 DEG OUT OF PHASE WITH PISTON STROKE.
THIS ILLUSTRATES MORE CLEARLY THE PRESSURE CHANGES DURING FUEL COMBUSTION OR INJECTOR FAULTS MAY BE DETECTED FROM ITS SHAPE.
COMPRESSION PRESSURE AND MAX PRESSURE CAN BE MEASURED FROM THIS DIAGRAM.
3. LIGHT OR WEAK SPRING DIAGRAM
IT IS AGAIN SIMILAR TO THE POWER CARD AND IN PHASE WITH THE ENGINE, BUT TAKEN WITH A LIGHT COMPRESSION SPRING FITTED TO THE INDICATOR SHOWING PRESSURE CHANGES DURING EXHAUST AND SCAVENGE TO AN ENLARGED SCALE.
IT CAN BE USED TO DETECT FAULTS IN THESE OPERATIONS.
THE PRESSURE BEING LOW, LIGHT SPRING IS USED. THE EXHAUST VALVE OPENS AT ‘A’ AND THERE IS INSTANTANEOUS DROP IN PRESSURE. PRESSURE DROPS TO Pb TILL SCAVENGE PORTS OPEN (AT ‘B’) AND SCAVENGING TAKES PLACE. THE DIAGRAM SHOWS SCAVENGE AIR PRESSURE Pa AT CYLINDER INTAKE.
#For Irregularities in diagrams and counter actions Refer to our next Post.
Author AMIT


Post a Comment